Showing posts with label citizen science. Show all posts

Wednesday, August 19, 2015

2015 Project Limulus Horseshoe Crab Spawning Survey Summary for Guilford,CT

Greetings to all MAS supporters and Project Limulus volunteers,

Here is my annual summary of the 2015 Project Limulus Survey Sessions. Our horseshoe crab surveys began on May 1st and ended on June 18th.

We weregiven 150 tags by the Sacred Heart Project Limulus professors. We were easily able to use them all and we could have used more but they were not available. All of the crabs tagged this year were found in Indian Cove or at Cha
ffinch Island Park.

The Project Limulus volunteers surveyed the two beaches at Indian Cove in Guilford a total of 14 times. The surveys are conducted around the time of the full moon and the new moon and always begin at high tide. The standardized surveys are always done in Indian Cove but tagging can be done at any of the Guilford beaches.

The total number of crabs counted during the standardized surveys was 108. Last year the total counted was 174 but that number included one night when we counted 97 crabs! Finding that many in one night was highly unusual and I believe it inflated our average number of crabs per survey found that year. The average number of crabs found per survey for the last 6 years is as follows:

2010 - 6.5 crabs per survey
2011- 7.1 crabs per survey
2012 - 7.8 crabs per survey
2013 - 3.06 crabs per survey
2014 - 10.24 crabs per survey
2015 - 7.1 crabs per survey

My unscientific guess is that storms Irene and Sandy had something to do with the low average number of crabs found in 2013. With the exception of 2013 and 2014, the horseshoe crab population in Indian Cove seems to be fairly stable.

Recaptures are crabs which have already been tagged. We record their tag numbers in our data. Our recapture totals have been declining over the past 4 years but we don’t know why. This year we only found 20. If you find a horseshoe crab and it has a tag, please record the I.D. number and call the phone number on the tag to report it. Please make note of the date and where you found it. Dead crabs with tags are important to report as well.


I am sincerely grateful to all of the people who were able to help this year. I am fortunate to have such an awesome group of volunteers!

Best regards, 
Judy Knowles 

Thursday, August 28, 2014

Citizen Science: Old Weather

In order to have the most accurate computer models for weather and climate forecasting accurate data from the past is needed. One under utilized resource is the extensive records contained in the weather observations contained in ships’ logs.
The British Library holds an extensive collection of logs from the ships of the English East India company in the period from the 1780s to the 1830s. About half of the logbooks for those ships that traded between the UK and India or China have measurements that are useful to scientists.
While Charles Darwin was taking notes on the Beagle that he would use for his great work on evolution, Robert FitzRoy, the Captain, and his crew also recorded the weather in their logs of the records at every point the ship visited.
Late 19th and early 20th century Antarctic expeditions provide data for the southern hemisphere where data is otherwise hard to come by.
And Arctic and worldwide weather observations made by United States ships since the mid-19th century are contained in their ships’ logs.

Excerpt from a ship’s log.

By taking part in Old Weather (oldweather.org) you can help scientists recover these Arctic and worldwide weather observations made by transcribing ships’ logs. These transcriptions will contribute to climate model projections and will improve our knowledge of past environmental conditions. Historians will use your work to track past ship movements and tell the stories of the people on board.
Historic measurements allow scientists to reconstruct weather patterns and extremes from the past allowing them to identify changes in the Earth’s climate over time.
USS Jamestown, one of the ships whose logs are to be transcribed.
With more information about historical weather variability, we can improve our understanding of all forms of weather variability in the past and so improve our ability to predict weather and climate in the future.
Scientists will input weather readings into a database in order to identify weather patterns and extremes. This allows them to test climate projections of how the Earth’s weather will develop in the future against how the climate has behaved in the past.
The numbers themselves give us recordings of temperature and pressure at a particular location - wherever the ships were. Hundreds or thousands of points’ location data from ships can be fed into computer models of the atmosphere, and out of that computer model of the atmosphere comes a weather map.
But instead of feeding in the current data to look at the future, scientists will put in the data from the past - or some of the variables - and reuse the model and the understanding of the physics of the ocean atmosphere system that’s in the models to reconstruct all the other variables that are interrelated physically. The result is a 3D picture of the weather all over the globe.
If we’re worried about extreme weather - unusual events, very large heat waves - then that perspective, that extra length of our records - give us more information about how likely events like that are to occur in the future.
The more people that take part in Old Weather, the more accurate the extracted data will be. Each logbook will be looked at by more than one person allowing mistakes and errors to be filtered out.
For more information and to register to transcribe the records go to oldweather.org.

Horseshoe Crab Numbers Increase in Project Limulus Survey

Judy Knowles Reports
Last year there was a significant drop in the number of crabs counted during the standardized survey. The average number of crabs was less than half of what it was in 2010, 2011, and 2012. During those three years the average number of crabs counted was 7.13; last year the average was 3.06 crabs per survey. This year our average was up to 10.24 crabs per survey! This is a huge increase and I am cautiously optimistic. The reason for my caution is that we had one night survey on May 30 when the group counted an unusually large number of crabs during the survey, a total of 97 between the two beaches. We have never counted that many during a survey before! That one night made our average for the season much higher than it would have been had we not gone out to the beaches that night.
The 2014 survey season began on May 12 and ended on June 29. The Project Limulus volunteers surveyed the two beaches at Indian Cove a total of 17 times. Tags were in short supply for Sacred Heart’s Project Limulus and we were only given 100 tags. We didn’t have enough tags for individual taggers this year. All of the crabs were tagged by the group in Indian Cove with the exception of 2 crabs from Joshua Cove (Trolley Rd.), which volunteer Ann Delaney and I tagged when we took them to visit the first and second grades at Kasimir Pulaski Elementary School in Meriden. We used all 100 tags and we could have used more had they been available.
The total number of crabs counted this year was 174. Last year the total was 49.
Recaptures are crabs which are already tagged. Our recapture total was low this year with only 10 recaptures compared to 34 last year. This is puzzling and I have no guess as to why this happened.
My subjective opinion is that we did see more crabs this year, both during the day and night surveys. Let’s hope that this trend continues next year.

I would like to thank all of the volunteers for their enthusiasm and dedication. I would not be able to continue to do this study without your support and encouragement.


Wednesday, June 25, 2014

Menunkatuck Facilitates Repair of Osprey Platform, Initiates Inspection Program

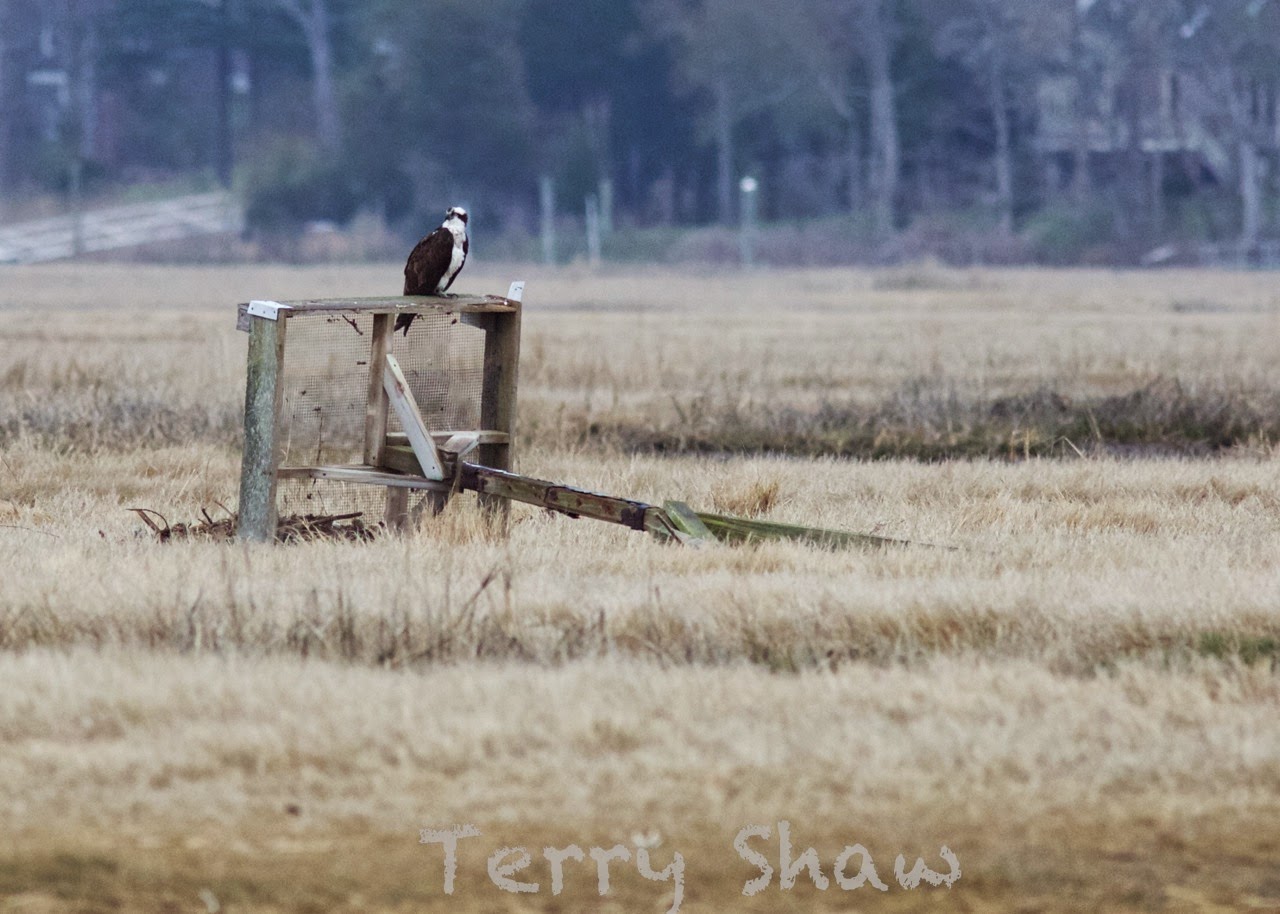
On Thursday, May 8, 2014, Menunkatuck learned that one of the osprey platforms in the East River salt marsh in Guilford collapsed after three days of high winds. Terry Shaw went to the Guilford boat launch to assess the situation and found the osprey pair standing on the fallen nest. Later reports were that the ospreys were mating.


After determining that the platform was on Guilford Land Conservation Trust property and getting the OK from them to repair it, Terry contacted Guilford dock master Rod McLennan and made plans to go out and attempt to make repairs.


Friday morning Terry, Rod, and Town marina employee Rick Anderson took the dock master boat to the site of the platform with all the materials needed to repair the platform. When they got to the platform and the damage was closely inspected, it was clear that although the hardware that had held one of the support braces to its ground post looked good at the ends, it had rusted through in the middle and broken. Without the support braces the platform leaned so far in the wind that the pole snapped at ground level. They also discovered that the ospreys’ three eggs had broken.


Using a new 12’ pole, four new brace posts in the ground, and all new bottom boards, everything was through bolted with 1/2” galvanized bolts. The new base was sistered to the original post with the nest still in good shape.

The 12-foot 4X4 post, eight 8-foot 2X4s, and rust-resistent ½-inch bolts, washers, and nuts to repair the platform cost $160. Your donations to Menunkatuck help us pay for unforeseen expenses like this.

During the weekend the ospreys were seen carrying sticks to remake the nest and later were observed mating.


This is the third platform that has collapsed in the last three years. In June, 2011, one along the Branford Trolley Trail fell when the hardware holding its supports rusted through. The nest was swept away in the tide and the two chicks were lost. In January, 2012, another platform in the Neck River marsh in Madison had so much nest material on its platform that it became top heavy and was close to falling. We were able to remove most of it and get the pole upright once again. Later in 2012 another platform fell because of rusted hardware. There are two platforms near the mouth of the West River in Guilford that from a distance appear to be fragile.
These osprey platforms were installed in the late 1980s and early 1990s when the osprey population started to recover from the devastation that DDT had caused. Now after 20 years or more, the hardware is rusting through and the platforms are no longer stable.
To be proactive rather than reacting to collapsed platforms, Menunkatuck is undertaking an inspection and repair program for the platforms in our Chapter area, the towns from West Haven to Madison. We know where many osprey platforms are located, but not all. So as to have as complete an inventory as possible we have prepared an online survey that you can use to tell us about platforms that you are aware of. 
We also need volunteers to work on the inspections and repairs. We will train you as to what to look for and how to retrofit the platforms with new braces and upgraded hardware.
Inspections and repairs will be done after the ospreys have left in August and September. Our goal is to have all of the then completed before the ospreys return from South America next March. 

The online survey can be found at http://goo.gl/rRFYGE.

The osprey chicks were doing well when the osprey platform along  the Trolley Trail in Branford collapsed and the nest was swept away. 

This platform in Guilford’s Chittenden Park has only two braces; it should have four.

Thursday, April 17, 2014

Citizen Science: What’s Invasive! and IPANE

Native plants and animals have evolved to coexist in a balance where the animals use the plants as a food source and the plants use the animals to reproduce. Non-native invasive species disrupt
this balance that has taken eons to reach.
Invasive plants crowd out native ones, often by starting their growing season before native plants or growing faster. Most invasive plants are eaten by a very small number of native insects. With fewer insects there is less food for breeding birds to feed their nestlings. The fruit of invasive plants will be eaten by birds and other animals, but it is less nutritious.
Invasive insects can kill native plants. Connecticut has been hit by the gypsy moth, the Japanese beetle, and the hemlock woolly adelgid, and we have seen the damage that has been done. New on the scene is the emerald ash borer which can kill an ash tree in two to three years.
To combat invasive plants, experts need to know where to find them. That’s the main idea behind the What’s Invasive app, a joint effort by UCLA’s Center for Embedded Networked Sensing (CENS), the National Park Service and the Center for Invasive Species and Ecosystem Health at the University of Georgia.
The app displays local lists of invasive plants or animals (with images) that have been identified by the National Park Service and other management authorities. Users can help experts pinpoint invasive species by locating them and providing experts with GPS coordinates, accompanied by a photo and notes about the observation. The geotagged observations and photos are used to alert experts about the spread of habitat-destroying species. Users can also go online to whatsinvasive.com and set up their own site for invasive species data collection.
Visit whatsinvasive.com for more information or to set up your own site for invasive species data collection.
Another app for helping scientists map invasive species is from the Invasive Plant Atlas of New England. IPANE’s mission is to create a comprehensive web-accessible database of invasive and potentially invasive plants in New England that will be continually The database will facilitate education and research that will lead to a greater understanding of invasive plant ecology and support informed conservation management. An important focus of the project is the early detection of, and rapid response to, new invasions.
updated by a network of professionals and trained volunteers.
This app allows IPANE to become mobile and allow IPANE users to report sightings of invasive plants directly in the field.
For more information about IPANE and how to volunteer, visit eddmaps.org/ipane/.

Both apps are available for iOS and Android smart devices. Links to the App Store and Google play for the apps can be found at apps.bugwood.org/apps.html.

(From the May, 2014 newsletter.)

Sunday, February 23, 2014

Citizen Science: Wildlife Health Event Reporter

The Wildlife Health Event Reporter, www.wher.org, is a web-based application created to record wildlife observations by citizens concerned about dead or sick wildlife.
Early detection of disease events that affect wildlife is often difficult to achieve. There must be observers in the area to take note of the event, and have knowledge of what to do with that information, as well as beat scavengers to the evidence. To help address this need, the Wildlife Data Integration Network (WDIN) developed WHER.
After wildlife disease events are recorded in WHER, these observations are joined with other wildlife sightings and are viewable in tabular reports or on a map, enabling people to see where similar events are happening.
Why Collect this Information?
Seventy-five percent of recent emerging infectious diseases in humans began as animal infections and most of these have involved wildlife. With the help of citizens, this system can collect timely and useful information about wildlife mortality events (e.g. date, location, and affected species).
These data are integrated and summarized by the system to provide essential information for better understanding wildlife disease patterns and their potential impact on wildlife, human, and domestic animal health.


How Can Citizen Scientists Help?
Individuals can help with this wildlife health surveillance effort by reporting their sightings of sick/dead wild animals to WHER.
After creating an account, users can begin entering their observations. The system will guide them step by step through the process. Data recorded includes: 
  • Date and location 
  • Species of animal(s) involved 
  • Actions taken 
  • Additional event observations 
  • Images of species involved or environment surroundings of event

After a user completes a report, contact information and a description of observations of interest for the area’s local wildlife agency is provided, if available. The details usually include what kind of events the group is interested in and who to contact directly. This extra effort to make direct contact when suggested will help control out-breaks more quickly and may curtail their spread. Users can also contribute reports to WHER using their smartphone. HealthMap.org has enhanced its application, “Outbreaks Near Me,” to collect and provide animal disease reports to WHER. The mobile application captures similar data elements that the web-based WHER application collects.

Visit the About page on the WHER web site at www.wher.org.

Saturday, December 7, 2013

Citizen Science: iNaturalist.org

iNaturalist.org is a place where you can record what you see in nature, meet other nature lovers, and learn about the natural world.
From hikers to hunters, birders to beach-combers, the world is filled with naturalists, and many of us record what we find. What if all those observations could be shared online? You might discover someone who finds beautiful wildflowers at your favorite birding spot, or learn about the birds you see on the way to work. If enough people recorded their observations, it would be like a living record of life on Earth that scientists and land managers could use to monitor changes in biodiversity, and that anyone could use to learn more about nature.


That’s the vision behind iNaturalist.org. So if you like recording your findings from the outdoors, or if you just like learning about life, join in! Go to inaturalist.org for more information.
(From the January 2014 newsletter.)

Sunday, October 20, 2013

Citizen Science: Birds and Windows

It has been estimated up to 1 billion birds are killed in North America each year as a result of bird window collisions! This is one of the largest threats facing urban bird populations. Residential homes are estimated to represent 90% of building-related mortality, directly related to their large number compared to other building classes. However, more work is needed; only four studies in the past have focused on bird window collision mortality at houses.

The University of Alberta Birds and Windows Project was designed to use citizen science and active participation to continue to identify the factors that affect collision risk at residential homes.
Window glass is an invisible barrier to birds, and collisions occur as birds attempt to fly through what appear to be reflections of open space and vegetation. Generally, this occurs as a result of panic flights where birds panic due to pursuit by raptors, the presence of cats or larger birds arriving at feeders, loud noises, and being chased by other birds.


Environment factors, such as nearby trees and shrubs, and the presence of bird attractants, such as bird feeders, bird houses and bird baths, have been shown to increase the abundance of bird window collisions.

To better understand what can be done to reduce bird window collisions, the University of Alberta has developed this project to actively involve you in data collection. They are looking for people to search for evidence of bird window collisions on a regular basis. Ideally you will search your residence daily for a period of at least one month. 

The researchers prefer daily searches as previous studies have shown this reduces the chance of evidence being lost due to searcher error or evidence being removed by scavengers. If window collision evidence is observed at a time other than during a perimeter search try to complete a full search at this time to maintain consistency and account for the possibility of multiple collisions.
Evidence of bird window strikes include dead or injured birds found beneath a window or blood smears, body smudges or feathers found on the window glass. To help in understanding what happened to the bird when it collided, please take a photo of the collision evidence to be uploaded to the survey. Photos will help provide accurate species identification. If a dead bird and a body smudge on the glass are found for the same collision, take a picture of the bird as it will be used to identify the species.


After creating an online account, enter data about bird-window collisions by answering a series of questions and uploading photographic evidence.


For complete details visit birdswindows.biology.ualberta.ca/  and contact birdsandwindows@ualberta.ca if you have any questions.

Friday, August 16, 2013

Citizen Science: MonitorChange

On the ground impacts of Global Climate change, sea level rise, changes to our forests and landscapes, development, all can be measured with precise scientific instruments. But the money and time to do so is often just not there and thus major changes around us are happening but remain undocumented. However, a partial solution is at hand by simply taking pictures over time from the same location. Combine those pictures into a sequence and you directly and permanently document and demonstrate change,and these changes can then be quantified.
MonitorChange (monitorchange.org) a concept to crowdsource changes in the environments where we live, work, play, or care about, be they parks, our backyards, our rivers, or our city scape, using nothing more than camera phones. The new thing here is that multiple people with multiple cameras can take pictures which are then processed using existing software so that no matter what camera type or format the pictures were originally taken with they are transformed into uniform snapshots of the same scene with the same dimensions with all the objects in the pictures the same size and shape. This allows all the different pictures to be put into time lapse sequences that can be made into a video, a slide show, or used to measure change direct over days, years, or decades.

The concept uses little more than a camera phone and a stout piece of bent steel to start.
A piece of angled steel is firmly mounted to provide a consistent height, angle and direction from which to shoot images using nearly any camera. When collected together, photo-stitching software aligns and pieces together images to show changes over time.


This concept has lots of applications to the type of work that ecologists, foresters, land managers, and environmental citizen groups do and provides an easy (and actually information dense) way of tracking long-term changes using volunteers using the smart phone that many carry in their pocket.
People can do this right now using existing materials at single sites or they can organize networks of camera stations at scales of parks, cities, watersheds, counties, states, countries, or the world.
Right now, MonitorChange is a presentation of an idea. Anyone can modify this in any way they like and implement it at any scale. No copyrights. No permissions needed. 
A short video explaining the MonitorChange can be found at http://youtube/A1ULAsEQAWs.
For more technical details on doing the picture rectification see the video at http://www.youtube.com/watch?v=w2pEKjw3Idk
Possible places/groups to implement are watershed societies, riverkeepers, stream crossings, trail clubs, stream monitoring groups; coastal beaches, dunes, marshes; lichen plots, restorations sites, forestry sites, parks, refuges, new developments, your backyard, construction of a building, the green-up in spring and the leaf drop in the fall of forests and so forth
For more information and to sign up go to monitorchange.org.
MonitorChange was developed by Sam Droege, a biologist at the USGS Patuxent Wildlife Research Center in Maryland.

Friday, August 9, 2013

Project Limulus 2013 Season

2013 was Menunkatuck Audubon's fifth year of volunteering for Sacred Heart University's Project Limulus.  It was another disappointing season for finding horseshoe crabs in Guilford.  There seemed to be even less on our beaches than last year.  The number of crabs counted during the surveys had been fairly consistent over the past 3 years but this year that number dropped by more than half.  According to the DEEP, the horseshoe crab population in Long Island Sound is stable, but we saw a significant change on the 2 beaches we survey in Guilford.


The 2013 survey period began on May 8th.and ended on June 25th.  Our Project Limulus team surveyed the 2 beaches at Indian Cove a total of 16 times and counted a total of 49 crabs.  We had to cancel more surveys than usual this year due to inclement weather and holidays.


150 crabs were tagged at the following Guilford beaches:  Indian Cove Public Beach, Indian Cove Private Beach, Shell Beach,Joshua Cove, Chaffinch Island, and Grass Island.

We found 34 recaptures.  Recaptures are crabs which have been previously tagged.

I would like to thank the volunteers who helped with the project at all hours of the day and night, in all kinds of weather.  This study could not be done without you.


                                             2010                     2011                  2012                   2013            

Total crabs tagged-            370                       975                     240                     150
Total recaptures-                  26                        262                       61                       34


                                             2010                    2011                   2012                   2013

Total crabs counted 
during surveys -                   151                      171                     165                       49


Total number of 
surveys conducted           2010                   2011                   2012                   2013

                                                  23                       24                        21                       16


Average number               2010                   2011                   2012                   2013 
of crabs per 
survey                                     6.5                       7.1                      7.8                       3.0